Methodology
Association Rule Mining, or ARM, is a rule-based unsupervised machine learning method for discovering interesting relations between variables in large datasets. It is mostly used on market/transaction data and intended to identify strong rules discovered in databases using Support, Confidence, and Lift rules. The definition and formula for each rule is shown below:
Support measures how frequently the item appears in the dataset, the proportion of transactions in the dataset containing item X. Sup({X}, {Y}) = (numberof X and Y)/Number_of_Transactions
Confidence measures how often the rule is true, which indicates the proportion of the transactions that contain X, which also includes Y. Conf({X}, {Y}) = P ({X}, {Y}) / P({X})
Lift measures the ratio of the observed support to that expected if X and Y were independent. Lift ({X}, {Y}) = Sup({X}, {Y}) / Sup({Y}) * Sup({X})
If the lift is equal, it will imply that the probability of the antecedent and that of the consequent are independent of each other. When two events are independent of each other, no rule can be drawn involving those two events.
If the lift is larger than 1, that lets us know the degree to which those two occurrences are dependent on one another and makes those rules potentially useful for predicting the consequent in future data sets.
If the lift is less than 1, that lets us know the items are a substitute. This means that one item's presence has a negative effect on other items and vice versa.
Dataset
| Dataset | Type | Description | Condition |
|---|---|---|---|
| Data6_1: Subreddit "Keto" | Corpus/Text Data | Derived from corpus generated from previous study, this dataset only consists of indexing number and content of each subreddit submission. | To convert into transaction data, it requires the removal of punctuations, special characters, etc |
| Transaction.csv | Transaction/Basket | Derived from Data6_1, used python for cleaning and preparing. R language for ARM and Networking | Cleaned, Usable |
Section A: Prepare Data for Association Rule Mining
This section only uses python for cleaning and preparing transaction data for later activities. The first step is to read the corpus data into the Pandas data frame and extract only the content. Then, remove special characters like "%" as well as punctuations from the content. Also, it removed common English stopwords from content to reduce the noise level. Finally, remove NaN cells and save the data frame as a CSV file.
A - 1: Remove Punctuation and Special Characters
After reading original data6_1 into the Pandas data frame. In the table below, the column "content" represents raw data, and column "content_2" removed special characters as well as punctuations. Column "content_3" removed common English stopwords from "content_2" column
#import re
#Remove Special Characters and punctuations using re
myData['content'] = myData.iloc[:,1]
myData['content_2'] = myData['content'].map(lambda x: re.sub(r'\W+', ' ', x))
# Remove Stopwords
stop = stopwords.words('english')
myData['content_3'] = myData['content_2'].apply(lambda x: ' '.join([word for word in x.split() if word not in (stop)]))

A-2: Remove NAs and Create Transaction Dataset
The code below demonstrates the splitting sentence column into multiple columns of words. After splitting, empty cells are removed. The basket variable is then shrunk down to 5 rows to have faster processing speed and less wait time. The table below is a snapshot of the transaction CSV file, which will be used in later activities
temp = myData['content_3'].str.split(' ').apply(Series, 1)
basket = temp.fillna(' ')
basket = basket.backfill(axis=0)
basket_shrinked = basket.iloc[0:5,:]
Section B: ARM in R
This section only uses R for association rule mining tasks. Association rule mining tasks in R are made easy with the library(arules) and library(arulesViz). Apriori function significantly helps ARM tasks include frequent itemsets, association rules, or association hyperedges. The Apriori algorithm also employs a level-wise search for frequent itemsets.
B - 1: Print and Plot Top 15 Support, Confidence and Lift Rules
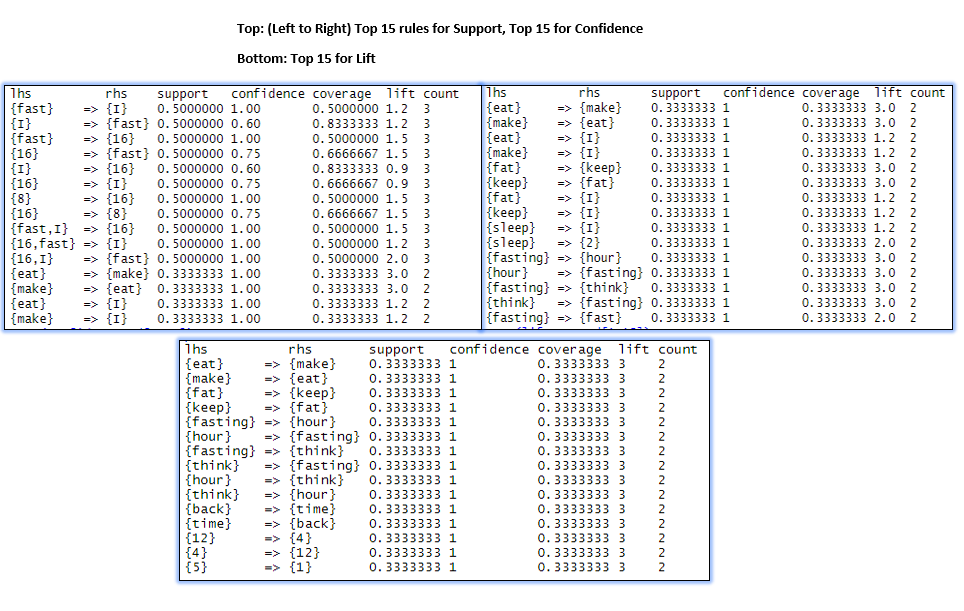
Printed output from the console window provides direct feedback of rules outcomes.
arules::apriori(transac_data, parameter = list(support=.3,
                                                  confidence=.5, minlen=2))
Many attempts were made to the parameters of the apriori function. Setting too low will lead to very long computation time; setting too high will yield little results. Ultimately, the apriori functions' parameters are set at sup 0.3, conf 0.5, and minimum length 2, giving a satisfactory outcome to facilitate findings and general discoveries.

The plotted rules provide the distribution of rules with two different color maps.
B - 2: Additional Visualization
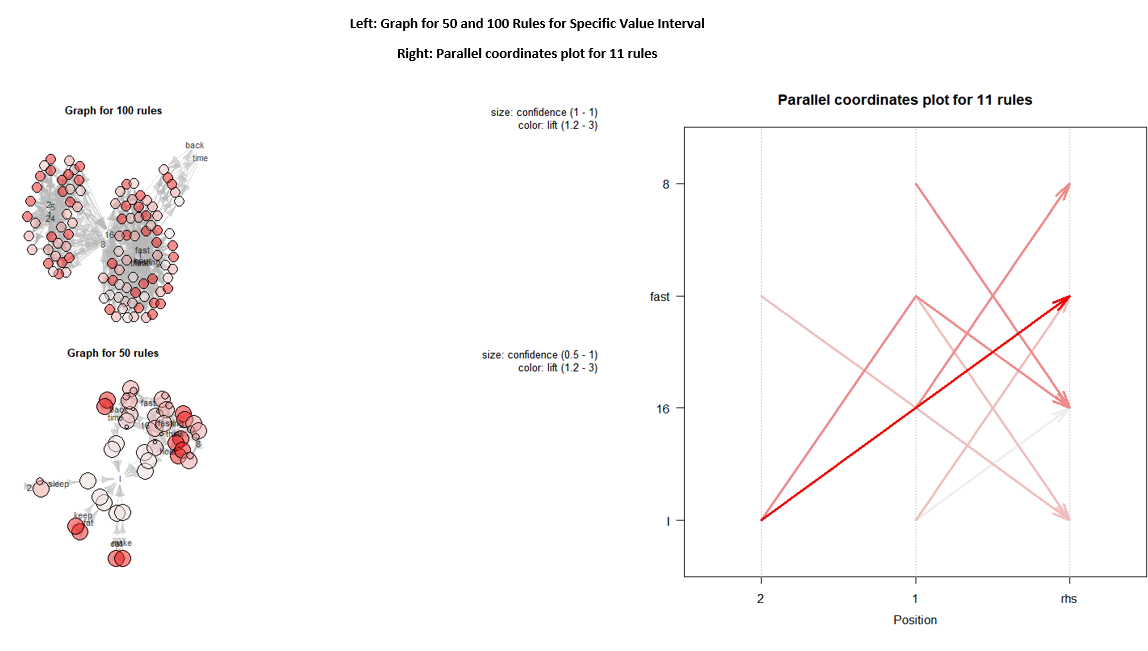
This part experimented with some other plotting methods for ARM tasks, which provides different looks to the ARM rules and linkage between nodes.

Section C: Network3D in R
Networks are mathematical graphs with nodes and edges. Network graphs can be directional, and edges can be weighted as well. In the plot above, a generic static graph/network has already experimented with. This section is looking to practice the use of Network3D and generate HTML interactive graphs. The code below in R achieves that:
networkD3::saveNetwork(D3_network_Tweets,
                       "Reddit_KetoSubmission_11rules.html", selfcontained = TRUE)
Because there are about 700 plus rules generated from the apriori function, the inter-node relationship isn`t very clear or too concatenated together for any insights to be discovered. Therefore, the apriori function's parameters are adjusted to sup at 0.4 to reduce the overall output size.
 arules::apriori(transac_data, parameter = list(support=.3,
                                                  confidence=.5, minlen=2))
After applying the change, the number of output rules is reduced down to 11 rules. Another network3d Html graph is generated.
Discussion
Association Rule Mining (ARM) is a great way to find inter-relationship between itemsets in a dataset. Through this study, it is vital first to prepare a transaction dataset before analysis tasks. There are three essential rules data scientists should understand: support, confidence, and lift. The notable difference can also be found at the apriori function, where the parameters' adjustment can yield a significant difference in outcomes. The number of output is different, and how itemset on Left Hand Side(LHS) and Right Hand Side(RHD) are allocated is differed.
There are many ways to visualize the output from the apriori function. The simplest way is the print or inspects from the console in Rstudio. One can also use a scatter plot to visualize the distribution using different colormap to differentiate. Parallel graphs, interactive graphs are also useful in terms of expanding ways to look at the output.
The network 3d graph provides a more elevated and enhanced graph, including edges and nodes linking together and provides interactive features. You can understand the relationship between each set a lot better by dragging and dropping nodes. The group "16 fast, and I" is very prominent in the subreddit submission because keto diet is often coupled with intermittent fasting as a type of life style. Fasting means not eating, and 16 is the number of hours not eating. Intermittent fasting limits one's eating window to about 8 hours. After digesting this study's outcome, there are some preliminary trend: the most effective ketogenetic diet submission often has the implementation of intermittent fasting. By adapting to both keto diet and intermittent fasting, people have faster results of losing weight.