Methodology
Data Cleaning tasks can be varied by data types and generally requires different methods. There are numerical data, binary data, and record text data for the list of data gathered on the 'Data Gathering' page. Most datasets collected are existing data from reputable sites, with over 2000 rows each. The overall data cleaning methodology followed is as follows.
- Skim through each dataset for an overview of the data types and understand the amount of data presented in the dataset
- Read into python or R as data frame for data manipulation
- Check for the position of empty cells, then remove Nan or empty cells accordingly
- Drop redundant, duplicate columns or rows, depending on the dataset
- Expand single column that contains more than one information more columns
- Count the number of rows and columns for each dataset before and after the data cleaning process
- Use visualization technique for preliminary data analysis
The image here demonstrates the number of rows and columns of each dataset before and after the cleaning process. Data cleaning is a continuous effort, and what is shown here today might only be the preliminary version of what will be used in the future. Nonetheless, at this stage of the project, the cleaning process is considered to be thorough and finished.
Dataset : Overview of Data Gathered
| Dataset | Type/Information | Description | |
|---|---|---|---|
| Data1 | Numeric/Combined Data | Obesity Percentage By Country From 1975-2016 | |
| Data2 | Numeric/Text/Missing Values | Nutrition Physical Activity and Obesity Behavioral Risk Factor Surveillance System | |
| Data3_1 - 3_5 | COVID/Food/Protein/Geo-location | Food Supply by Country, Find Better Dietary Option for Stronger Body | |
| Data4 | Numeric/Text/Health | Acute Liver Failuer Data | |
| Data5 | Numeric/Text/Combined | Cardiac Disease Data | |
| Data6_1 - 6_2 | Corpus/Text/Combined | Subreddit Keto and Intermittend Fasting hottest submissions for a specific gathered date |
Data 1: Obesity Percentage By Country From 1975-2016
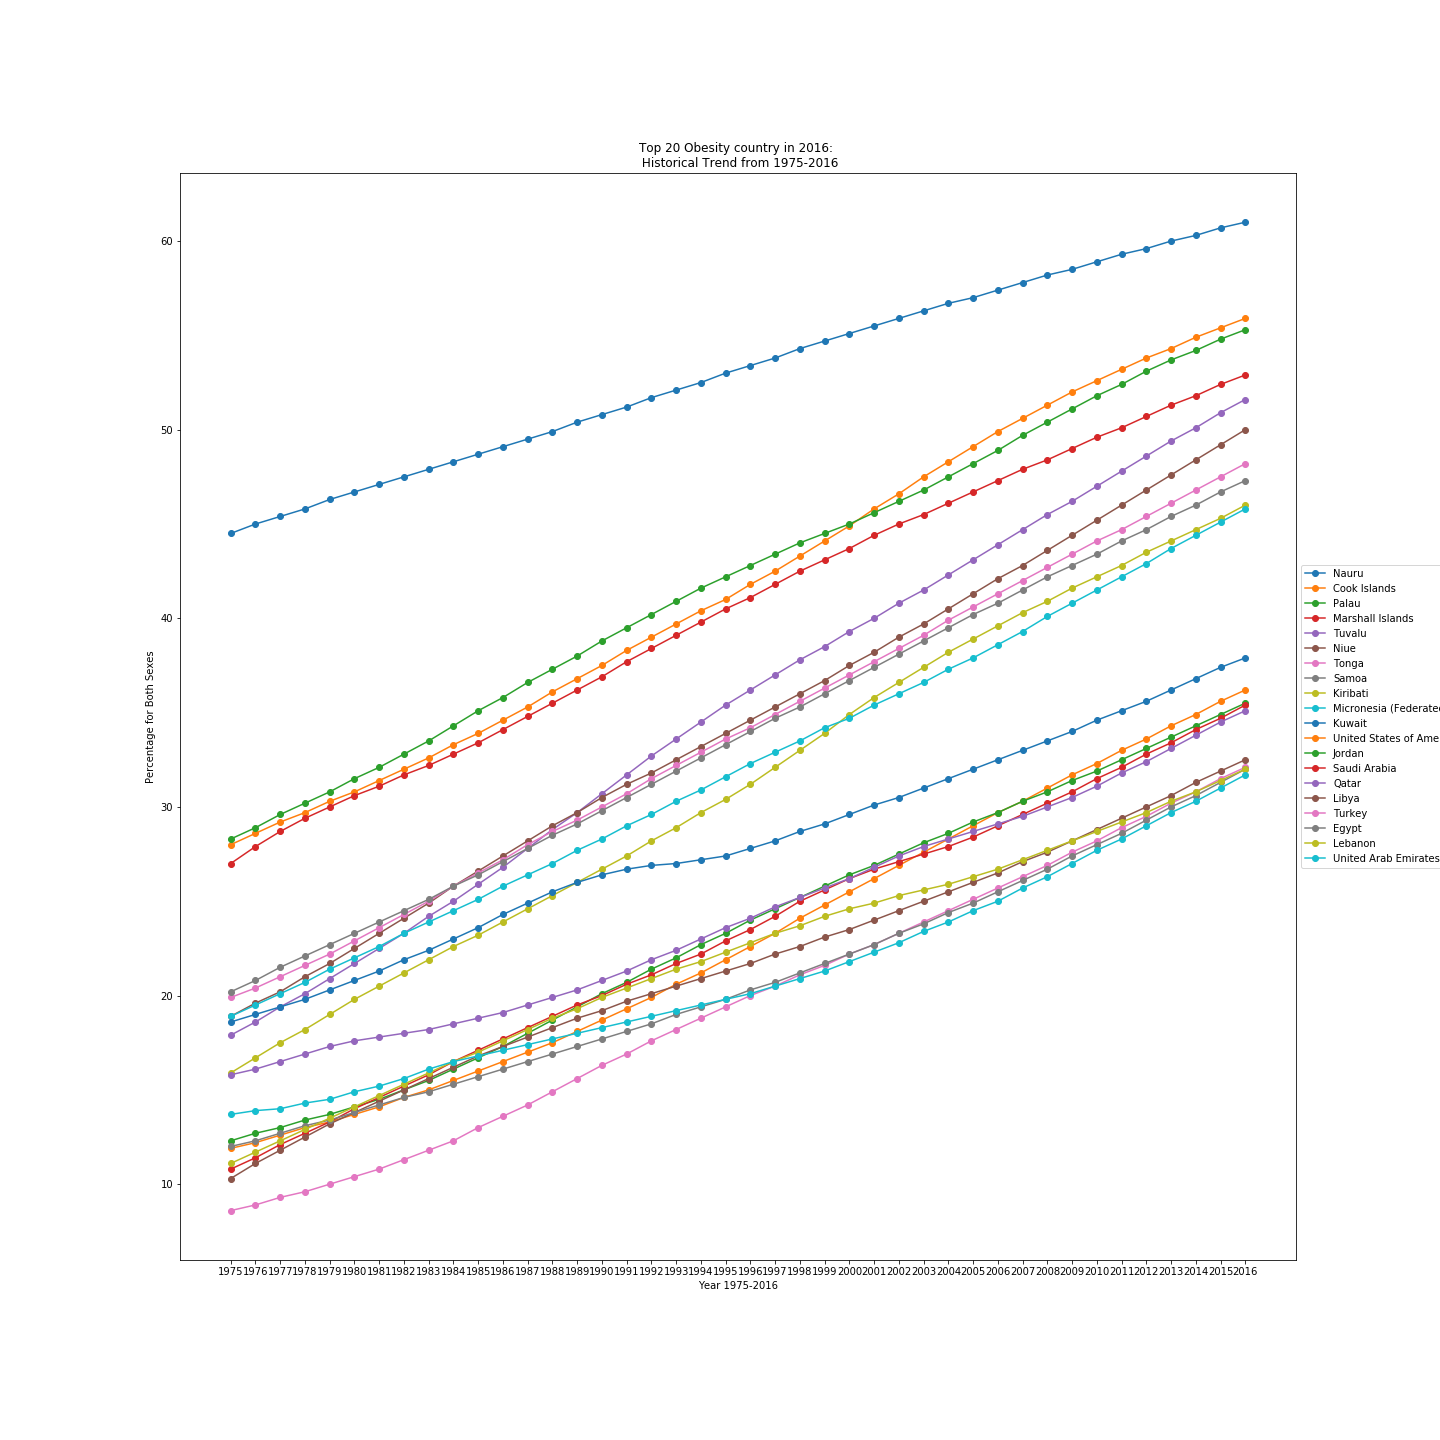
Data 1 consists of the obesity rate of each country from 1975 to 2016. Each rate is stored as a string element with an additional interval. Those intervals are discarded in a newly created column called Obesity. For the sex column, cells with 'No data' are removed. The before and after cleaning data frames are shown below. Additionally, to answer the hypothetical questions on the 'Introduction' page, the top 20 obesity rate countries are generated as a data frame in python, and a plot is shown below.
A sample plot below shows the data points taken from the top 20 obese countries between 1975 and 2016, proving the overall upward trend in the global obesity rate.

Data 2: Nutrition Physical Activity and Obesity Behavioral Risk Factor Surveillance System
For data2, most nan or empty cells are located in one or two columns. This was discovered by a function returning the index of empty or nan cells. However, as the use-cases for data2 are still unknown, no further cleaning is done besides removing the columns.
def df_isnan(dataframe):
    if dataframe.isnull().values.any() == True:
         a = 'have empty cells, needs additional removing'
    elif dataframe.isnull().values.any() == False:
         a = 'does not have empty cells, no furthur actions'
    return a
With other functions written in the python code working together, which should get rid of all unneeded NAs in the data frame.
Data 3: Food Supply by Country, Find Better Dietary Option for Stronger Body
For data3, besides removing empty or nan cells, couple of columns are also removed, including 'Undernourished', 'Confirmed,' 'Deaths,' 'Recovered,' 'Active,' 'Unit (all except Population)' since those columns are directed related to COVID-19 which is not in the scope of this study. This shrinks the overall size of data3(except data3_5, a dictionary for food categories).
Data 4 and Data 5: Acute Liver Failuer and Cardiac Disease Data
Data 4 and Data5 are more personalized data, including patients` body index, various health conditions. For data4, I kept most of the columns and rows and removed some redundant columns. For data5, since the original data has all information concatenated into a single column, I expanded it into 13 columns and removed empty cells. For both datasets, I categorized the level of obesity and generated a new column. This obesity level uses the Body Mass Index(BMI) as a guideline calculated based on the existing height and weight column.
Level of Obesity, categorized based on BMI
- 0 - 18.5, underweight
- 18.5 - 24.9, normal or heavy weight
- 24.9 - 29.9, overweight
- 29.9 - 35, obese class 2, low risk
- 35 - 40, obese class 2, moderate risk
- 40 - infinite, obese class 3, high risk
Code used to achieve cleaning:
#### data4: remove extraccolumns and  categorize obesity level, 0-underweight, 1-normal or healthy weight, 2-overweight, 3-obese class1, 4-obese class2, 5-obese class 3
data4.drop(['Weight','Height', 'Waist','Source of Care', 'PoorVision'],axis = 1, inplace=True)
data4['Obesity Level 0-5'] = pd.cut(data4['Body Mass Index'],bins=[0,18.5,24.9,29.9,35,40,50], include_lowest=True, labels=['0', '1','2','3','4','5'])

#### data5: split one column into multiple columns, calculate BMI, and assign obesity level to data use 1-3
data5['id'] = data5['id;age;gender;height;weight;ap_hi;ap_lo;cholesterol;gluc;smoke;alco;active;cardio'].str.split(';').str[0]
data5['age'] = data5['id;age;gender;height;weight;ap_hi;ap_lo;cholesterol;gluc;smoke;alco;active;cardio'].str.split(';').str[1]
data5['gender'] = data5['id;age;gender;height;weight;ap_hi;ap_lo;cholesterol;gluc;smoke;alco;active;cardio'].str.split(';').str[2]
data5['height'] = data5['id;age;gender;height;weight;ap_hi;ap_lo;cholesterol;gluc;smoke;alco;active;cardio'].str.split(';').str[3]
data5['weight'] = data5['id;age;gender;height;weight;ap_hi;ap_lo;cholesterol;gluc;smoke;alco;active;cardio'].str.split(';').str[4]
data5['ap_hi'] = data5['id;age;gender;height;weight;ap_hi;ap_lo;cholesterol;gluc;smoke;alco;active;cardio'].str.split(';').str[5]
data5['ap_lo'] = data5['id;age;gender;height;weight;ap_hi;ap_lo;cholesterol;gluc;smoke;alco;active;cardio'].str.split(';').str[6]
data5['cholesterol'] = data5['id;age;gender;height;weight;ap_hi;ap_lo;cholesterol;gluc;smoke;alco;active;cardio'].str.split(';').str[7]
data5['gluc'] = data5['id;age;gender;height;weight;ap_hi;ap_lo;cholesterol;gluc;smoke;alco;active;cardio'].str.split(';').str[8]
data5['smoke'] = data5['id;age;gender;height;weight;ap_hi;ap_lo;cholesterol;gluc;smoke;alco;active;cardio'].str.split(';').str[9]
data5['alco'] = data5['id;age;gender;height;weight;ap_hi;ap_lo;cholesterol;gluc;smoke;alco;active;cardio'].str.split(';').str[10]
data5['active'] = data5['id;age;gender;height;weight;ap_hi;ap_lo;cholesterol;gluc;smoke;alco;active;cardio'].str.split(';').str[11]
data5['cardio'] = data5['id;age;gender;height;weight;ap_hi;ap_lo;cholesterol;gluc;smoke;alco;active;cardio'].str.split(';').str[12]

data5.drop(['id;age;gender;height;weight;ap_hi;ap_lo;cholesterol;gluc;smoke;alco;active;cardio'],axis=1,inplace = True)
data5['age'] = pd.to_numeric(data5['age'])/365
data5['weight'] = pd.to_numeric(data5['weight'])
data5['height'] = pd.to_numeric(data5['height'])
data5['Body Mass Index'] = data5['weight']/pow(data5['height']/100,2)
data5.drop(['weight','height'], axis=1,inplace=True)#
data5['Obesity Level 0-5'] = pd.cut(data5['Body Mass Index'],bins=[0,18.5,24.9,29.9,35,40,50], include_lowest=True, labels=['0', '1','2','3','4','5'])

data5['gender'].replace('1','F',inplace=True)# change representation of gender to string
data5['gender'].replace('2','M',inplace=True)
Data 6_1 and Data 6_2: Scraping Reddit with PRAW(API) in Python
For data6_1 and data6_2, a collection of text data from the subreddit 'Intermittent Fasting' and 'Keto', the 'subreddit', 'URL,' 'created' columns are dropped. Each row is converted to a text file for the' body' column and generates a text file corpus.
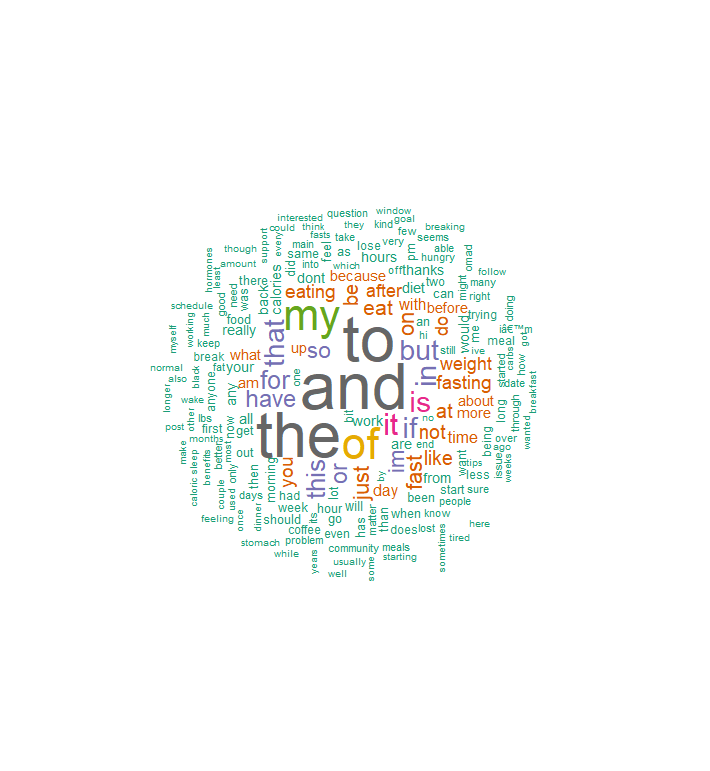
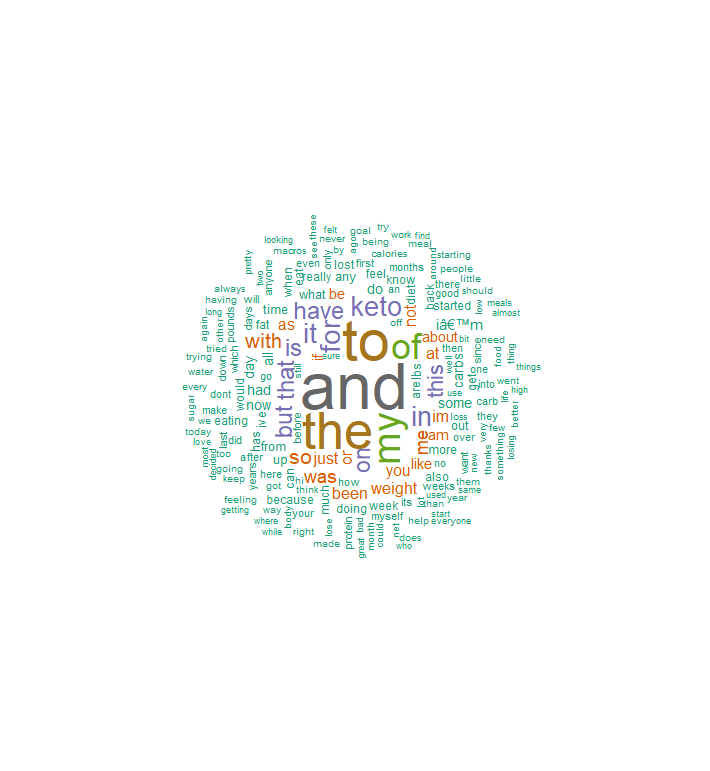
The corpus was immediately put into exploratory study and generated two simple word clouds, one for data6_1, one for data6_2


As you can see, there are lots of words that may be removed by using other machine learning packages like sci-kit learn, etc. So it is possible more can be done here to extract information further from the dataset.